


Projected protein requirements for animal consumption in South Africa
APRIL 2025 PROJECT FOR THE PROTEIN RESEARCH FOUNDATION (PRF)
Index
Introduction
The primary objective of the Protein Research Foundation (PRF) is to replace imported protein sources with domestically produced alternatives. Following extensive exploration of various strategies over several years, the PRF strategically shifted its focus toward sectors offering the greatest potential for impact – specifically, the soybean and canola industries.
The expansion of the local oilcake supply has become a key performance indicator for evaluating the success of the PRF's initiatives, which include research, technological advancement, and technology transfer efforts. Achieving future targets, maintaining the current momentum, and ultimately attaining self-sufficiency will require accurate projections of future oilcake demand and a clear understanding of the necessary production levels and timelines.
Over time, the PRF has developed and employed several versions of the APR model to monitor progress.
This model integrates:
- Changes in per capita consumption of meat, milk, and eggs, as projected by the Bureau for Food and Agricultural Policy (BFAP),
- Population growth trends,
- Anticipated import and export volumes of animal products,
- Projected future prices and availability of major raw materials, particularly those produced as by-products of agricultural processing industries.
It also accounts for genetic improvements in livestock, which significantly influence productivity and, by extension, feed requirements. The model calculates both total feed needs and the composition of raw materials required.
Additionally, it incorporates the feed demands of non-food-producing animals, which also consume considerable amounts of protein-based feed.
A notable feature of the model is its ability to apply least-cost linear programming, factoring in transport costs across various regions. This capability enables the formulation of region-specific feed strategies, considering the availability of local raw materials. Consequently, it provides a highly accurate projection of domestic and imported protein requirements.
The steady growth in domestic oilcake production remains a vital benchmark for the PRF's success. Continued support through research, innovation, and technology dissemination will be essential to meet future targets. To this end, the PRF employs the Animal Product Requirement (APR) model, developed in collaboration with BFAP data, to forecast future oilcake demand and map the path toward self-sufficiency.
The model will also be utilized to conduct scenario analyses assessing the potential impact of avian influenza (bird flu) on the availability and demand for protein sources in animal feed. By simulating different outbreak scenarios, including varying levels of severity and duration, the model will help quantify the effects on feed consumption patterns across different species.
Results
Current scenario
Based on current per capita consumption of animal products, and utilizing the APR Model, it is estimated that South Africa’s total animal feed requirements are as illustrated in Table 1. This analysis is based on data covering the full calendar year of 2024.
Table 1: National animal feed production 2024 Feed types National feed consumption (ton) Aquaculture 9 510 Broiler 3 484 239 Cattle beef 2 883 446 Cattle dairy 2 700 057 Horses 137 099 Layer 1 006 295 Ostriches 109 308 Pets 396 604 Pigs 1 207 871 Sheep 319 845 Various 10 Grand total 12 254 285 In terms of oilcake the largest consumed oilcake is still soya oilcake followed by sunflower oilcake.
Table 2: Oilcake usage for 2024 Oilcake type National consumption (ton) Cotton full fat 27 755 Soya full fat 112 689 Canola oilcake 120 000 Soya oilcake 1 356 340 Sunflower oilcake 320 000 Palm kernel meal 6 000 Total 1 942 784 In the local market, South Africa has made significant progress in substituting imported soya oilcake with locally produced oilcake. In 2024, local production accounted for 88% of total domestic requirements, compared to just 12% in 2005.
However, the continued success of import substitution is heavily reliant on the efficiency of infrastructure and logistics networks, particularly in ensuring the delivery of raw materials to coastal regions at competitive prices. In 2024, favourable crushing margins supported the growth of local oilcake consumption at coastal feed mills.
The demand for oilcake remains highly sensitive to price fluctuations and competition from alternative protein sources. For example, increased production of lucerne or the availability of wet milling by-products can significantly impact oilcake usage.
Table 3: Historical usages of soya oilcake (Local and imported soybeans processed in South Africa) Year Local soya oilcake (ton) Total soya oilcake (ton) Local % 2001 121 140 598 070 20 2002 141 520 616 593 23 2003 120 000 705 352 17 2004 119 280 616 596 19 2005 92 080 740 558 12 2006 210 000 849 678 25 2007 303 280 1 115 280 27 2008 253 200 1 261 791 20 2009 181 600 1 111 172 16 2010 251 840 1 083 640 23 2011 301 600 1 291 069 23 2012 347 760 1 271 341 27 2013 469 360 1 197 978 39 2014 565 280 1 232 687 46 2015 765 287 1 254 120 61 2016 768 800 1 218 001 63 2017 836 285 1 267 098 66 2018 766 795 1 150 521 67 2019 820 000 1 218 000 67 2020 849 700 1 213 700 70 2021 1 073 682 1 444 193 74 2022 1 153 519 1 337 122 86 2023 1 164 510 1 321 671 88 2024 1 198 122 1 356 340 88 In terms of total oilcake, the local share in consumption increases from 35% in 2005 to 92% in 2024. It is projected that the local share will increase to 94% in 2027 and 96% in 2033.
Table 4: Historical usages of Total oilcake (Local and imported oilcake) Year Local oilcake (ton) Total oilcake (ton) Local % 2001 454 192 1 021 862 44 2002 482 448 1 149 224 42 2003 472 312 1 210 396 39 2004 489 413 1 121 460 44 2005 416 736 1 212 593 34 2006 572 231 1 414 338 40 2007 608 370 1 635 525 37 2008 494 557 1 758 185 28 2009 565 181 1 664 927 34% 2010 701 030 1 743 137 49 2011 624 912 1 857 391 34 2012 766 927 1 856 360 41 2013 760 321 1 877 671 40 2014 913 356 1 889 979 48 2015 1 197 604 1 914 330 63 2016 1 238 120 1 965 291 63 2017 1 300 865 1 798 372 72 2018 1 441 527 1 649 498 87 2019 1 434 660 1 875 738 76 2020 1 485 183 1 885 663 79 2021 1 643 916 2 069 697 79 2022 1 870 954 2 071 475 90 2023 1 828 558 1 988 970 92 2024 1 778 566 1 942 784 92 Growth in requirements for animal products
Accurately calculating consumption figures across different species requires a clear understanding of underlying demand. Demand was determined by utilizing the following macroeconomic variables in conjunction with animal feed conversion ratios and growth figures:
- Population growth
- Per capita consumption growth
- Imported animal products
- Exported animal products
Table 5: Projections of feed and oilcake requirements to the years 2024, 2027 and 2033 Year Feed (ton) Oilcake (ton) Soya oilcake (ton) 2024 12 254 285 1 942 784 1 356 340 2027 12 845 386 2 008 442 1 397 871 2033 13 899 019 2 192 694 1 427 838 As previously noted, soybean oilcake remains the primary source of protein in South Africa’s animal feed industry. Its dominance has not only persisted but has strengthened over time and is expected to continue increasing. Future consumption trends are largely driven by Feed Conversion Ratios (FCRs); improvements in FCRs contribute to stabilising overall consumption. However, the potential growth in exports of beef, sheep, and poultry could significantly boost feed demand, thereby impacting projected consumption figures for 2033. It is important to note, though, that these export opportunities are contingent on materialising and are heavily reliant on the effectiveness of South Africa’s biosecurity measures.
Local soya oilcake production
The constant increase in local oilcake production from locally produced soybeans will make South Africa increasingly self-sufficient in protein requirements.
Table 6: Local vs imported soya oilcake Local soya oilcake Local soybean Total soya oilcake Local soya % Local (From local soybeans) ton Production (required) ton Requirements ton Production (required) ton self-sufficiency 2024 1 198 122 1 597 496 1 356 340 1 808 453 88 2027 1 293 611 1 724 815 1 397 871 1 863 828 93 2031 1 327 889 1 770 519 1 427 838 1 903 784 93 * Excluding full fat consumption
In 2024, total oilcake requirements in South Africa are estimated at 1,942,784 tons, with local production contributing 1,778,566 tons – equivalent to 92% of total demand (Table 4). The soybean seed (commodity) requirement for the same year is projected at 1,808,453 tons, excluding full-fat soybeans used for human consumption. This volume is necessary to produce approximately 1,356,340 tons of soybean oilcake.
Locally produced soybean oilcake is expected to meet 88% of South Africa’s total soybean oilcake demand in 2024 (Table 6), with forecasts indicating an increase to 96% by 2033. However, this projection is contingent upon industry competitiveness and profit/crush margins. Forecasts suggest that domestic soybean production will be sufficient to meet local demand, implying that additional markets beyond the feed sector – such as export markets – will be necessary to absorb the surplus. Nonetheless, logistical constraints continue to pose challenges to competing effectively with imports and must be addressed to achieve these targets.
A large proportion of oilcake production occurs inland and must be transported to coastal provinces such as the Western and Eastern Cape. In certain years, favourable crushing margins support increased local utilisation. To satisfy domestic demand by 2033, approximately 1,903,784 tons of soybeans will be required.
Figure 1: Growth in self-sufficiency in terms of soya oilcake 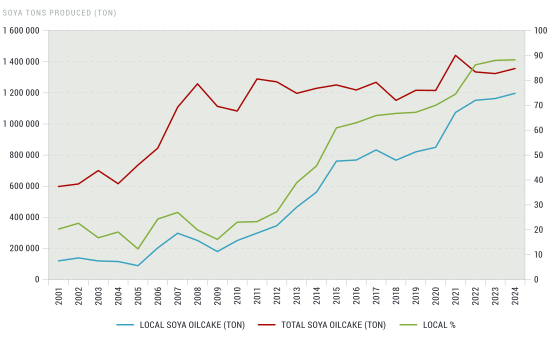
Broiler and layer diets play a critical role in the animal feed industry, with the growth and long-term sustainability of the poultry sector being a key driver of future oilcake demand. Encouragingly, the poultry industry’s importance has been acknowledged in the latest sector masterplan submitted to government.
In recent years, avian influenza (bird flu) has had a significant impact on the poultry sector and its effects are still evident in the market. Going forward, effective biosecurity and sound management practices across the broader livestock industry will be essential in safeguarding growth and ensuring the consistent consumption of feed.
Beyond natural population growth, the most substantial driver of increased animal feed consumption is the expansion of exports of animal products – including mutton, beef, and poultry. Maintaining and enhancing export competitiveness will therefore require a focused effort on health standards, infrastructure, and market access.
Figure 2: Specie feed consumption 2024 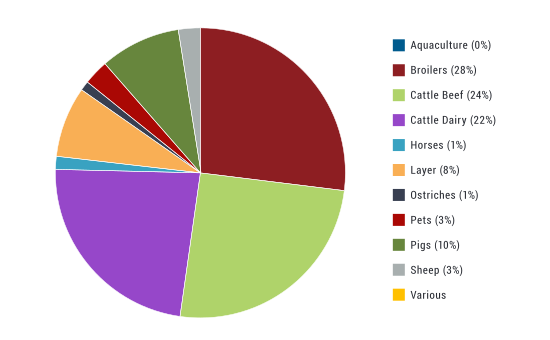
Table 7: National animal feed production 2027 and 2033 Feed type 2024 2027 2033 National feed consumption (ton) Aquaculture 9 510 10 241 11 304 Broiler 3 484 239 3 609 234 4 115 332 Cattle beef 2 883 446 2 918 659 3 157 286 Cattle dairy 2 700 057 2 785 141 2 763 125 Horses 137 099 147 641 162 968 Layer 1 006 295 1 262 110 1 432 570 Ostriches 109 308 126 537 105 309 Pets 396 604 427 100 471 438 Pigs 1 207 871 1 246 923 1 374 486 Sheep 319 845 311 790 305 191 Grand total 12 254 285 12 845 386 13 899 019
Conclusion on projections
The future outlook for feed demand in the animal protein sector appears promising, but it remains contingent on several key factors. Improvements in Feed Conversion Ratios (FCRs) continue to enhance efficiency, which, in turn, underscores the need to expand demand – particularly through increased exports of animal products and, potentially, processed products such as oilcake. These goals are central to various industry masterplans currently under consideration by government and will be critical for the long-term sustainability of the sector. However, the realisation of these positive projections has yet to materialise.
One of the most significant challenges remains the competitiveness and pricing of raw materials. For local feed consumption to remain viable, raw material prices must align more closely with export parity levels. This presents a challenge in terms of ensuring the economic feasibility of domestic production. The pricing of protein sources, in particular, is a sensitive issue. A key indicator in this regard is the maize-to-soybean price ratio, which has a direct influence on feed formulation decisions.
In light of growing raw material production, questions arise about the potential for future export opportunities. While certain commodities are already suitable for export, further prospects may lie in the export of value-added products such as oilcake. However, the protein raw material basket is complex, and even minor shifts in the supply or importation of one protein source can significantly affect the demand for others – especially soybean oilcake.
Crushing margins also play a pivotal role in determining the level of self-sufficiency, as they influence the competitiveness of locally produced (inland) oilcake versus imported coastal alternatives. When inland production cannot be delivered to coastal markets at competitive prices, imports tend to dominate. Consequently, if exports of animal products do not increase, domestic utilisation could come under pressure, directly impacting local production volumes.
Logistics and biosecurity will be critical determinants of the industry's future performance. Efficient logistics are essential to maintaining cost competitiveness, particularly for transporting inland products to coastal consumers. At the same time, biosecurity is increasingly important – not only for maintaining and expanding export markets, but also for safeguarding domestic production. This has been clearly demonstrated by the ongoing impact of avian influenza outbreaks, such as the one experienced in 2023, which had a profound effect on the industry.
Table 8: Self-sufficiency of total oilcake and oilcake 2024 2027 2033 Total oilcake 92% 94% 96% Soya oilcake 88% 93% 93% Additional Scenario analysis on animal feed given disease outbreaks
The South African animal feed industry is a critical component of the broader agricultural value chain, supplying nutrition to the poultry, beef, dairy, pork, and sheep sectors. However, its stability is highly vulnerable to outbreaks of transboundary animal diseases, notably Avian Influenza (AI) in poultry and Foot-and-Mouth Disease (FMD) in cloven-hoofed animals. These diseases not only threaten animal health but also disrupt feed demand, logistics, and international trade.
In a disease-vulnerable environment like South Africa, biosecurity must be viewed as a strategic pillar of the animal feed market. The recent bird flu and FMD outbreaks underscore the importance of proactive investment in biosecurity infrastructure, training, and technology to protect both livestock productivity and feed industry resilience.
Avian Influenza
Below is an analysis based on the impact of Avian Influenza as well as sensitivity scenarios explaining the impact on various different raw materials.
Avian Influenza (AI), commonly referred to as bird flu, has had a significant impact on the South African poultry sector, particularly in 2023 and 2024. The highly pathogenic strain (HPAI H7 and H5) led to extensive culling of both broiler breeders and commercial layer flocks, resulting in major disruptions in bird numbers and associated feed consumption.
- The broiler sector was affected primarily at the breeder level, with an estimated 20-25% reduction in parent stock during peak outbreaks.
- This drop translated into a shortfall in day-old chick production, delaying broiler cycles and constraining supply to the market.
- The commercial broiler population saw a temporary reduction of 10-15%, especially during the last quarter of 2023 and early 2024.
- The layer industry was more severely hit, with culling of over 9.5 million layer birds, amounting to roughly 30% of the national layer flock.
- This created a critical shortage of table eggs, prompting increased imports and price spikes.
- Recovery has been slow due to the time required to raise replacement pullets (approximately 16-18 weeks to point of lay).
The following analysis explains the impact Avian Influenza had on the feed market between 2022 and 2024 illustrating the impact on total feed reduction. Table 9 illustrates the consumption per specie. Because of the impact on Boilers and Layers the total feed consumption in the country decrease with 2%.
Table 9: National feed consumption Feed types 2022 2024 % change National feed consumption Broiler 3 743 167 3 484 239 -7% Cattle beef 2 864 511 2 883 446 1% Cattle dairy 2 546 373 2 700 057 6% Layer 1 279 836 1 006 295 -27% Pigs 1 178 683 1 207 871 2% Pets 377 494 396 604 5% Sheep 278 810 319 845 13% Horses 130 493 137 099 5% Ostriches 92 415 109 308 15% Aquaculture 5 253 9 510 45% Grand total 12 497 046 12 254 285 -2% To assess the impact of Avian Influenza (AI) on raw material consumption, various scenarios were modelled, focusing solely on a reduction in the national hen population while keeping other livestock populations constant, 2024 were utilised as a base year. This approach was used to isolate and evaluate the specific effect of AI on layer feed demand. The ration formation is based on the current min and max requirements within the model. However, it is noted that each feed manufacturer or animal producers uses their own recipes. This is to give an industry viewpoint and not necessarily individual impacts. The most significant decreases in raw material usage were observed in yellow maize and soybean oilcake. Under a scenario reflecting a 30% reduction in the layer population, as experienced in 2023/2024, yellow maize consumption declined 210,243 tons, while soybean oilcake consumption dropped by 54,088 tons. This reduction in oilcake use corresponds to an estimated 72,117 tons of soybean production. Overall, total feed consumption decreased by 301,899 tons under this scenario.
Table 10: Scenarios of reduction in total number of hens and impact on raw materials categories Raw Material Categories 2024 10% 20% 30% 40% Ton Ton Decrease Ton Decrease Ton Decrease Ton Decrease Amino acids 20 788 20 650 -138 20 524 -264 20 393 -395 20 258 -530 Byproducts industry 772 984 773 050 65 772 901 -84 773 022 37 773 144 160 Byproduct milling 2 023 224 2 023 224 0 2 023 224 0 2 023 224 0 2 023 224 0 Byproduct wet mill 240 498 239 980 -518 239 462 -1 036 238 945 -1 553 238 427 -2 071 Fishmeal 6 812 6 812 0 6 812 0 6 812 0 6 812 0 Full fat 148 186 148 186 0 148 186 0 148 186 0 148 186 0 Grain 5 698 094 5 627 782 -70 312 5 558 583 -139 511 5 487 852 -210 243 5 417 252 -280 842 Minerals 581 004 569 323 -11 680 556 849 -24 153 545 367 -35 635 533 870 -47 132 NPN 54 143 54 151 8 54 134 -8 54 132 -10 54 143 0 Oilcake 1 802 340 1 784 285 -18 055 1 766 137 -36 203 1 748 252 -54 088 1 730 238 -72 102 Other 824 026 824 026 0 824 026 0 824 026 0 824 026 0 Rendering 82 187 82 187 0 82 187 0 82 187 0 82 187 0 12 254 285 12 153 656 -100 630 12 053 026 -201 259 11 952 397 -301 889 11 851 767 -402 518 In the broiler sector as illustrated in Table 11, the most significant reductions in raw material consumption were observed in yellow maize, soybean oilcake, and limestone. Based on a 10% decrease in broiler production aligned with the estimated impact during the 2023/2024 Avian Influenza outbreak yellow maize consumption declined by 280,842 tons, soybean oilcake by 72,102 tons, and limestone by 39,520 tons. The reduction in soybean oilcake equates to an estimated 96,136 tons of soybean production. In total, this scenario resulted in a 402,518 ton decrease in animal feed consumption for broilers.
When considering the combined impact on both broilers and layers specifically a 10% decrease in broiler production and a 30% decrease in layers the total reduction in yellow maize consumption reached 490,885 tons, and soybean oilcake consumption dropped by 369,491 tons. This combined scenario led to a total decrease of 704,407 tons in overall animal feed consumption.
Table 11: Scenarios of reduction in total number of broilers slaughtered and impact on raw materials Raw Material Categories 2024 10% 20% 30% 40% Ton Ton Decrease Ton Decrease Ton Decrease Ton Decrease Amino acids 20 788 20 258 -530 17 898 -2 890 16 447 -4 342 15 009 -5 780 Byproducts industry 772 984 773 144 160 750 266 -22 718 738 478 -34 507 726 727 -46 258 Byproduct milling 2 023 224 2 023 224 0 2 023 224 0 2 023 224 0 2 023 224 0 Byproduct wet mill 240 498 238 427 -2 071 240 498 0 240 498 0 240 498 0 Fishmeal 6 812 6 812 0 6 812 0 6 812 0 6 812 0 Full fat 148 186 148 186 0 148 186 0 148 186 0 148 186 0 Grain 5 698 094 5 417 252 -280 842 5 266 989 -431 105 5 053 514 -644 581 4 839 608 -858 486 Minerals 581 004 533 870 -47 132 550 830 -30 173 534 549 -46 454 518 074 -62 929 NPN 54 143 54 143 0 54 179 37 54 156 13 54 172 30 Oilcake 1 802 340 1 730 238 -72 102 1 592 342 -209 998 1 486 937 -315 403 1 382 067 -420 273 Other 824 026 824 026 0 824 026 0 824 026 0 824 026 0 Rendering 82 187 82 187 0 82 187 0 82 187 0 82 187 0 12 254 285 11 851 767 -402 518 11 557 437 -696 848 11 209 013 -1 045 272 10 860 590 -1 393 695 Foot and Mouth Disease
Over the past decade, South Africa has experienced multiple outbreaks of Foot-and-Mouth Disease (FMD), particularly in the provinces of Limpopo, KwaZulu-Natal, and parts of the Free State. These outbreaks have been primarily attributed to informal livestock movements and inadequate biosecurity practices. Should a severe FMD outbreak occur in feedlots across the country, it could result in a substantial decline in feed demand based on the assumption that culling is needed to control the disease and not quarantine.
To estimate this potential impact, 2024 was used as a baseline year, with various scenarios modelled based on reductions in feedlot cattle numbers. The most significant decreases in raw material consumption were observed in yellow maize and soybean oilcake. Under a scenario of a 10% reduction in feedlot cattle, yellow maize consumption decreased by 223,661 tons, while soybean oilcake declined by 12,888 tons, resulting in a total animal feed reduction of 253,497 tons.
In a more severe scenario reflecting a 40% reduction in feedlot cattle due to a widespread FMD outbreak yellow maize consumption dropped by 804,807 tons and soybean oilcake by 48,402 tons, leading to a total decrease in feed consumption of 1,013,989 tons, which equates to approximately 8% of the national animal feed usage.
Keep in mind this effect is simulated only for feedlot numbers and not the total impact of FMD.
Table 12: Raw material consumption under different feedlot number reductions due to FMD Raw Material Categories 2024 10% 20% 30% 40% Ton Ton Decrease Ton Decrease Ton Decrease Ton Decrease Amino acids 20 788 20 872 83 21 035 247 21 261 472 21 272 483 Byproducts industry 772 984 772 327 -657 772 868 -116 772 462 -522 772 237 -747 Byproduct milling 2 023 224 2 023 224 0 2 023 224 0 2 023 224 0 2 023 224 0 Byproduct wet mill 240 498 240 498 0 240 498 0 240 840 342 240 840 342 Fishmeal 6 812 6 812 0 6 810 -2 6 810 -2 6 810 -2 Full fat 148 186 148 186 0 148 186 0 148 186 0 148 186 0 Grain 5 698 094 5 474 433 -223 661 5 250 512 -447 582 5 060 756 -637 338 4 893 288 -804 807 Minerals 581 004 566 389 -14 614 552 521 -28 481 523 765 -57 238 490 026 -90 978 NPN 54 143 52 383 -1 760 49 773 -4 369 47 905 -6 237 45 198 -8 945 Oilcake 1 802 340 1 789 452 -12 888 1 775 650 -26 690 1 742 372 -59 968 1 709 742 -92 598 Other 824 026 824 026 0 824 026 0 824 026 0 807 287 -16 739 Rendering 82 187 82 187 0 82 187 0 82 187 0 82 187 0 12 254 285 12 000 788 -253 497 11 747 291 -506 995 11 493 793 -760 492 11 240 296 -1 013 989
Conclusion on impact of AI and FMD
This assessment highlights the significant vulnerability of South Africa’s animal feed sector to disease outbreaks, particularly Avian Influenza (AI) and Foot-and-Mouth Disease (FMD). Using 2024 as a baseline, scenario modelling revealed that both poultry and livestock disease events have substantial consequences for feed consumption and raw material demand.
In the case of AI, reductions in layer and broiler populations – reflecting conditions during the 2023/2024 outbreak – resulted in considerable declines in the consumption of yellow maize and soybean oilcake, with combined feed losses exceeding 700,000 tons. These decreases have a direct knock-on effect on grain and oilseed demand, and highlight the sector’s dependence on stable poultry output.
Similarly, FMD outbreaks present a serious risk to feed demand in the beef sector. A simulated 10% to 40% reduction in feedlot cattle due to FMD scenarios showed feed losses ranging from 253,497 to over 1 million tons, representing up to 8% of total national feed usage. These estimates are conservative, as they account only for feedlot cattle and not the broader livestock sector.
Overall, the data underscores the critical importance of disease prevention and biosecurity measures. Proactive management is essential not only to protect animal health and food security, but also to safeguard the stability of the animal feed industry and its associated value chains.